Real Time Supply Chain Risk Alerts
If you’re familiar with the Live Tiles on Microsoft’s PC and mobile operating systems, or you’ve created interactive widgets on your smartphone or tablet, you know how helpful it can be to have real time information like the weather forecast, or news alerts, appearing without having to open the app. The goal of our first ever Code Fest was to create that experience for our users to mitigate supply chain risk, and I’m excited to report we have developed a brand new tile for our Transport app!

We began Code Fest by focusing on how we could develop a feature that maps supply chain risks, and provides context for how external events can affect specific orders, shipments, and inventory within our user’s supply chains. It would be a game changer, and of enormous value to our community of user’s. What we came up with was the Risk Chain.
Scanning The Horizon For Risk
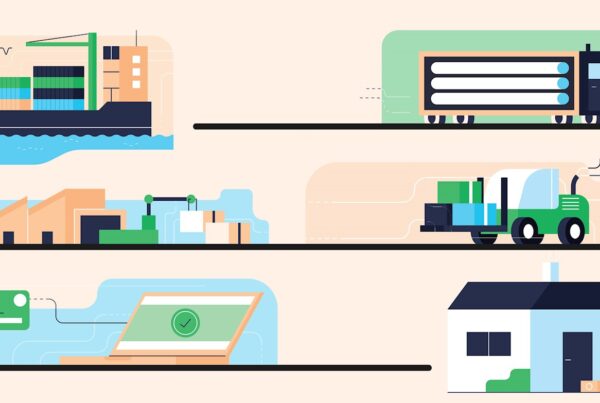
As more devices connect to the Internet and supply chains grow more fragmented, managers need to react to developments anywhere along the supply chain. By incorporating real time news feeds, weather feeds, and other pertinent information into the Risk Chain tile, our users will be able to find where a disruption may occur, and how that could affect their business.

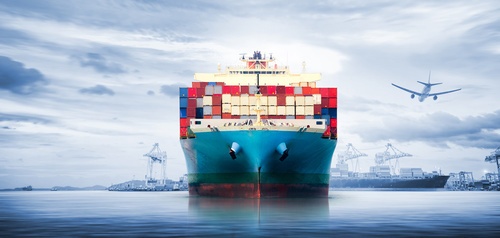
Consider how quickly you could react, and adjust if you knew in real time that a storm at sea might affect trade lanes. You could ask yourself whether you have an order on any vessels in those lanes, the priority of that cargo, and how you should adjust the shipping route. Quite simply put; context matters. The faster you’re made aware of “breaking news,” the quicker you can address, and mitigate potential issues; making you proactive, not reactive.
Harder Than It Looks
Using our simple but effective approach to UI, the Risk Chain tile provides information in a straightforward way that emphasizes the events relevant to your supply chain. The tile will capture multiple live feed sources, integrate them into the Gravity platform, and provide context to users.
One of the best things about a working event like Code Fest is that we learn new things, and improve our own skill sets in such a short time. This project was the first that demanded our coders create a Gravity ‘front-and-back tile’ from start to finish, and that’s a daunting challenge; actually, it’s several challenges rolled into one. Along with creating front and back tiles, we had to enable the program to:
- Plot events on a map with markers.
- Distinguish events based on both type and severity.
- Add news stories and images the user will find relevant, and helpful.
We already have other tiles that present data via maps, so the groundwork coding structure was already in place. Initially, we had two people ‘dual coding’, to get something up and running, but then they moved on to work within individual branches. They did face some ‘code merge conflicts,’ but overcame them by allocating their work accordingly to avoid any clashing.
It was a fascinating project, and I can’t wait for you to see the finished product. Stay tuned, and we’ll update you as this new tile goes live.
If you have any questions or suggestions for additional tiles, please let me know in the comments section below. To learn more about how Gravity Supply Chain Solutions can help you mitigate risk, click here to contact us for a demo today.